Normal Probability HD is perfect for anyone taking (or teaching!) statistics and probability.
For each calculation this app gives:
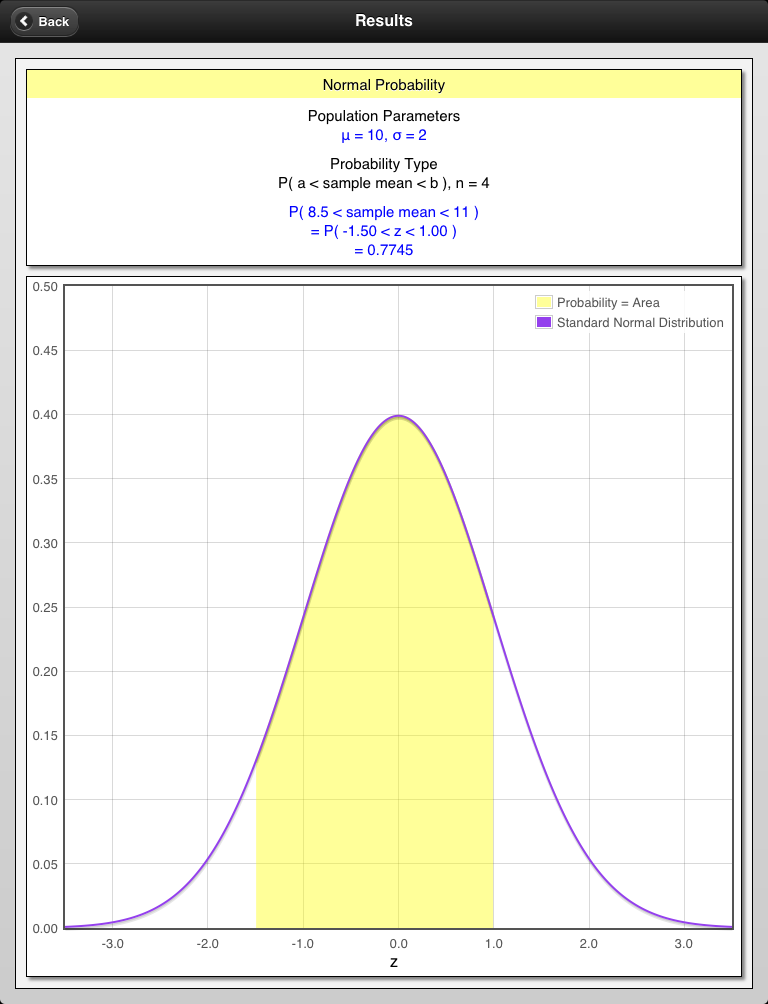
- the appropriate z-scores
- the resulting probability
- a graph highlighting the specific area under the Normal Distribution
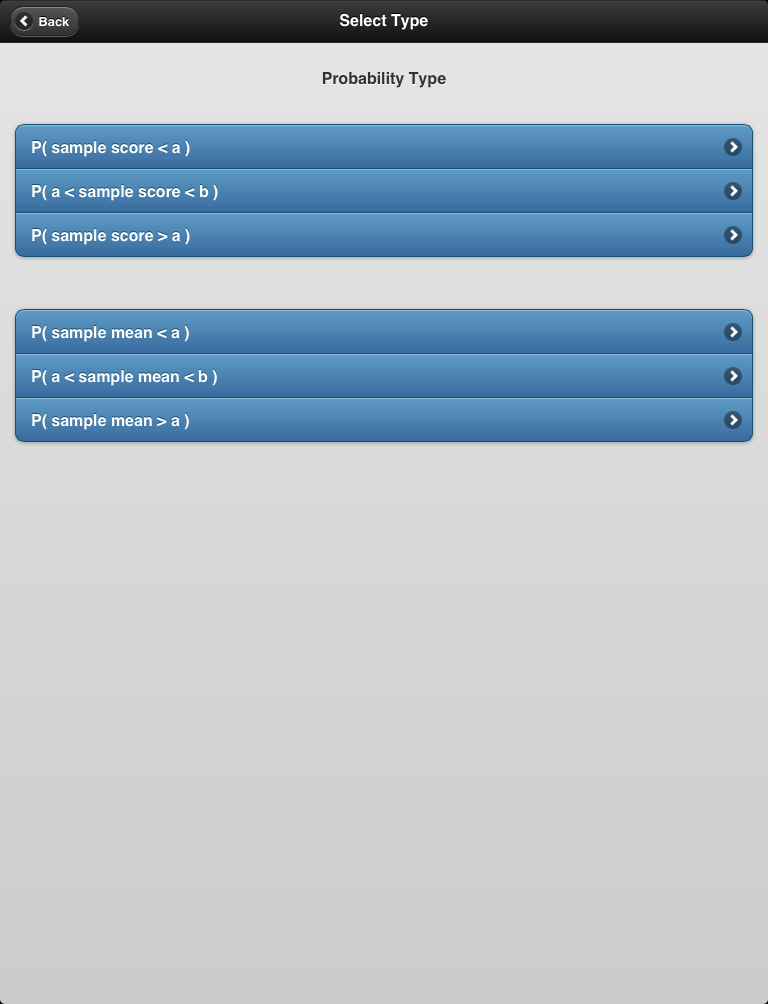
Probabilities are calculated for Individual Scores and Sample Means.
Additionally, probabilities for the standard normal distribution are easily calculated by setting the population mean to zero and the population standard deviation equal to one.
Critical Values are used for confidence interval construction and for hypothesis testing.
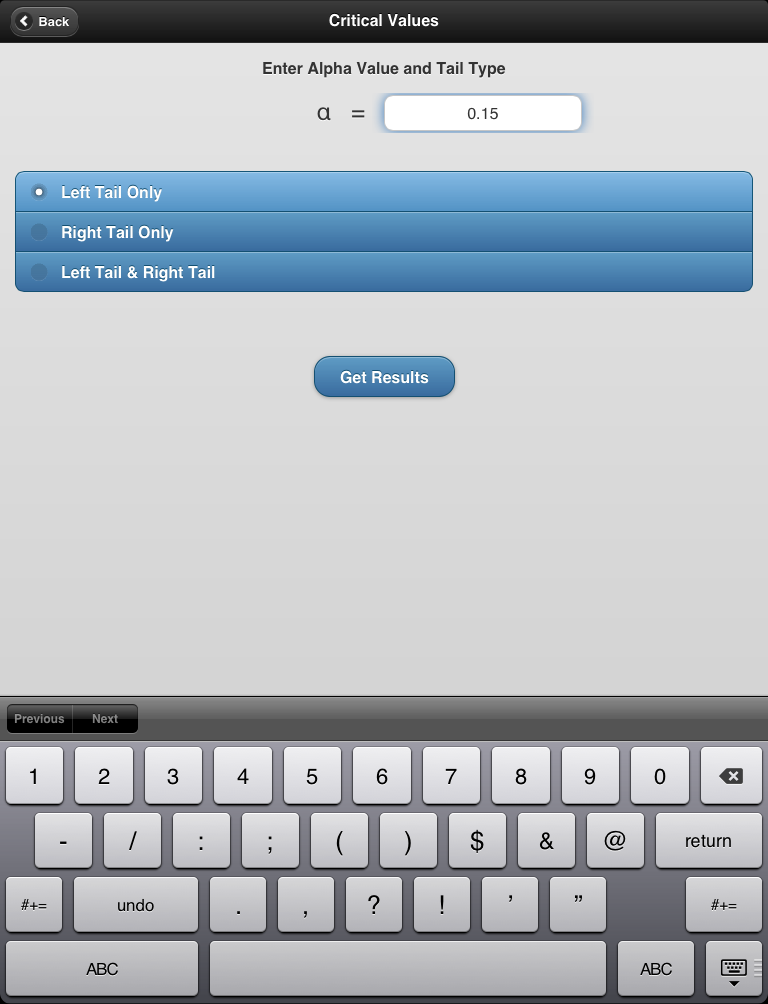
This app calculates Critical Values for all values of alpha α and for all three of the cases: left tail area, right tail area, and both left & right tail area. Additionally, a graph highlighting the specific area under the Normal Distribution is provided.
Normal Probability was written by a statistics professional with more than 20 years of educational experience. Give yourself an edge by getting this app!
Please send Questions or Comments to Apps@SciSyn.com
Look below for sample screen-shots from Normal Probability HD!
Probability can be calculated for a Sample Score or Sample Mean
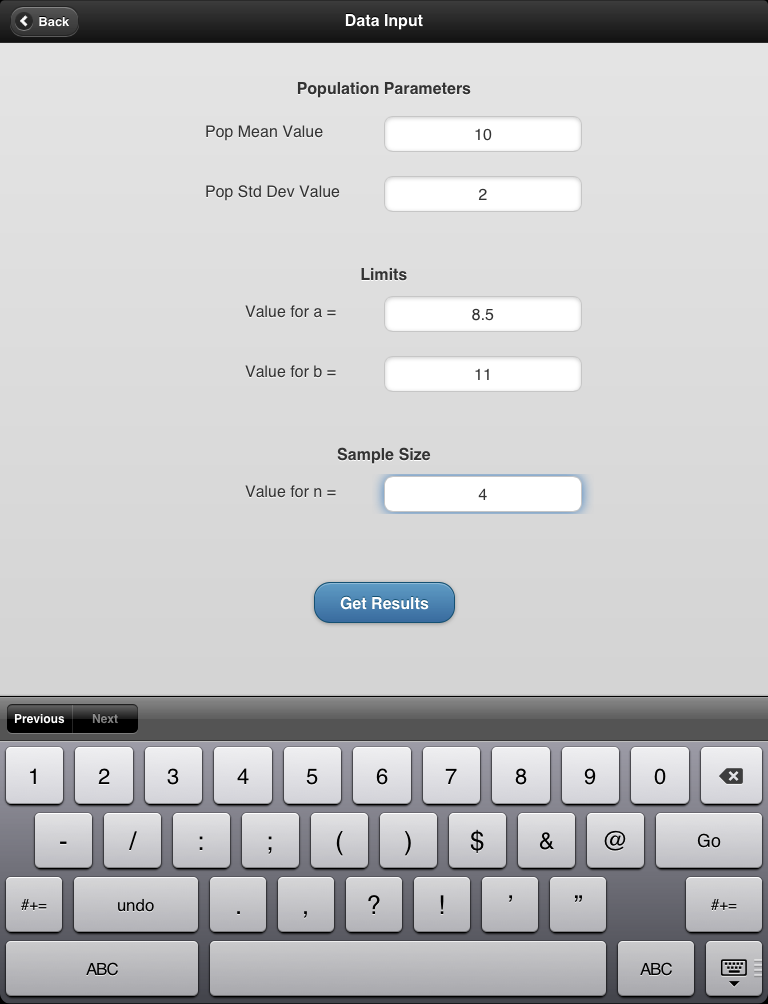
Example: P(8.5 < x̄ < 11) = ?, given that μ = 10, σ = 2, and sample size n = 4
Results are shown below - including the calculated z-scores and area under the normal curve
Critical Value Example: find the z-score when α = 0.15 and this area is in the left tail
Results are shown below - including the calculated z-score and area under the normal curve

![]()